**Quality control**
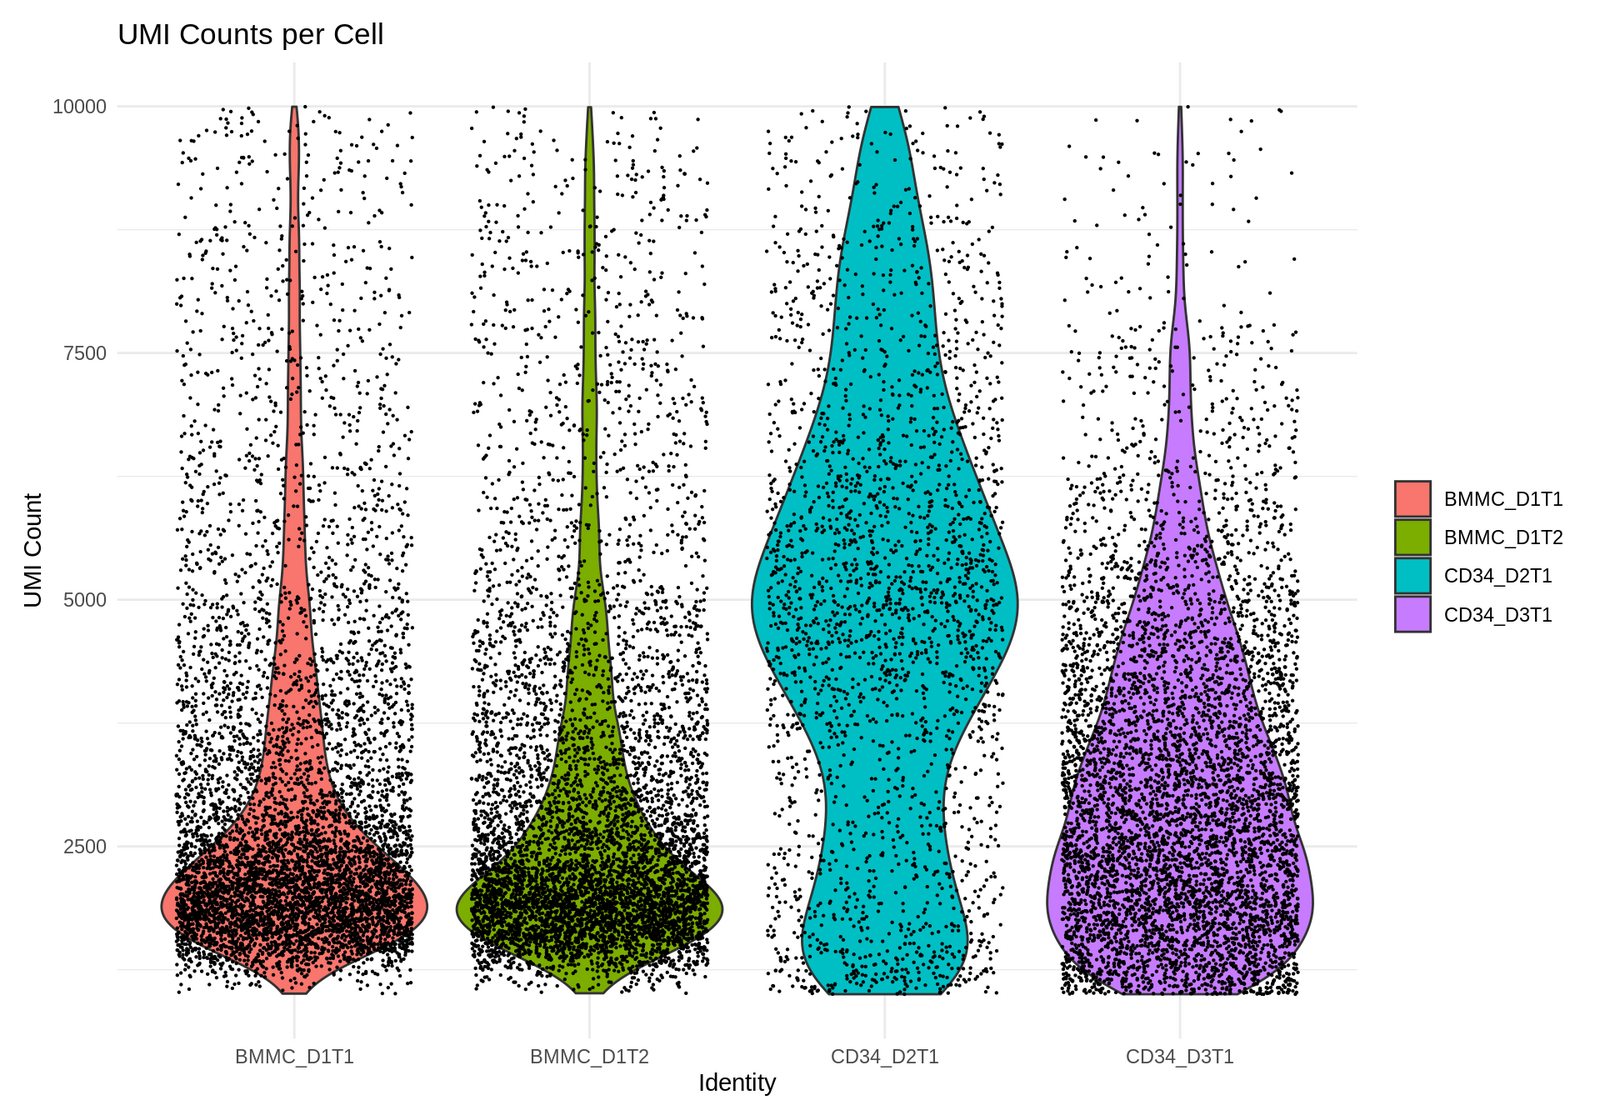 Per-cell UMI counts across the four samples before filtering — the basis for the median/MAD-derived QC thresholds.
|
**Batch correction**
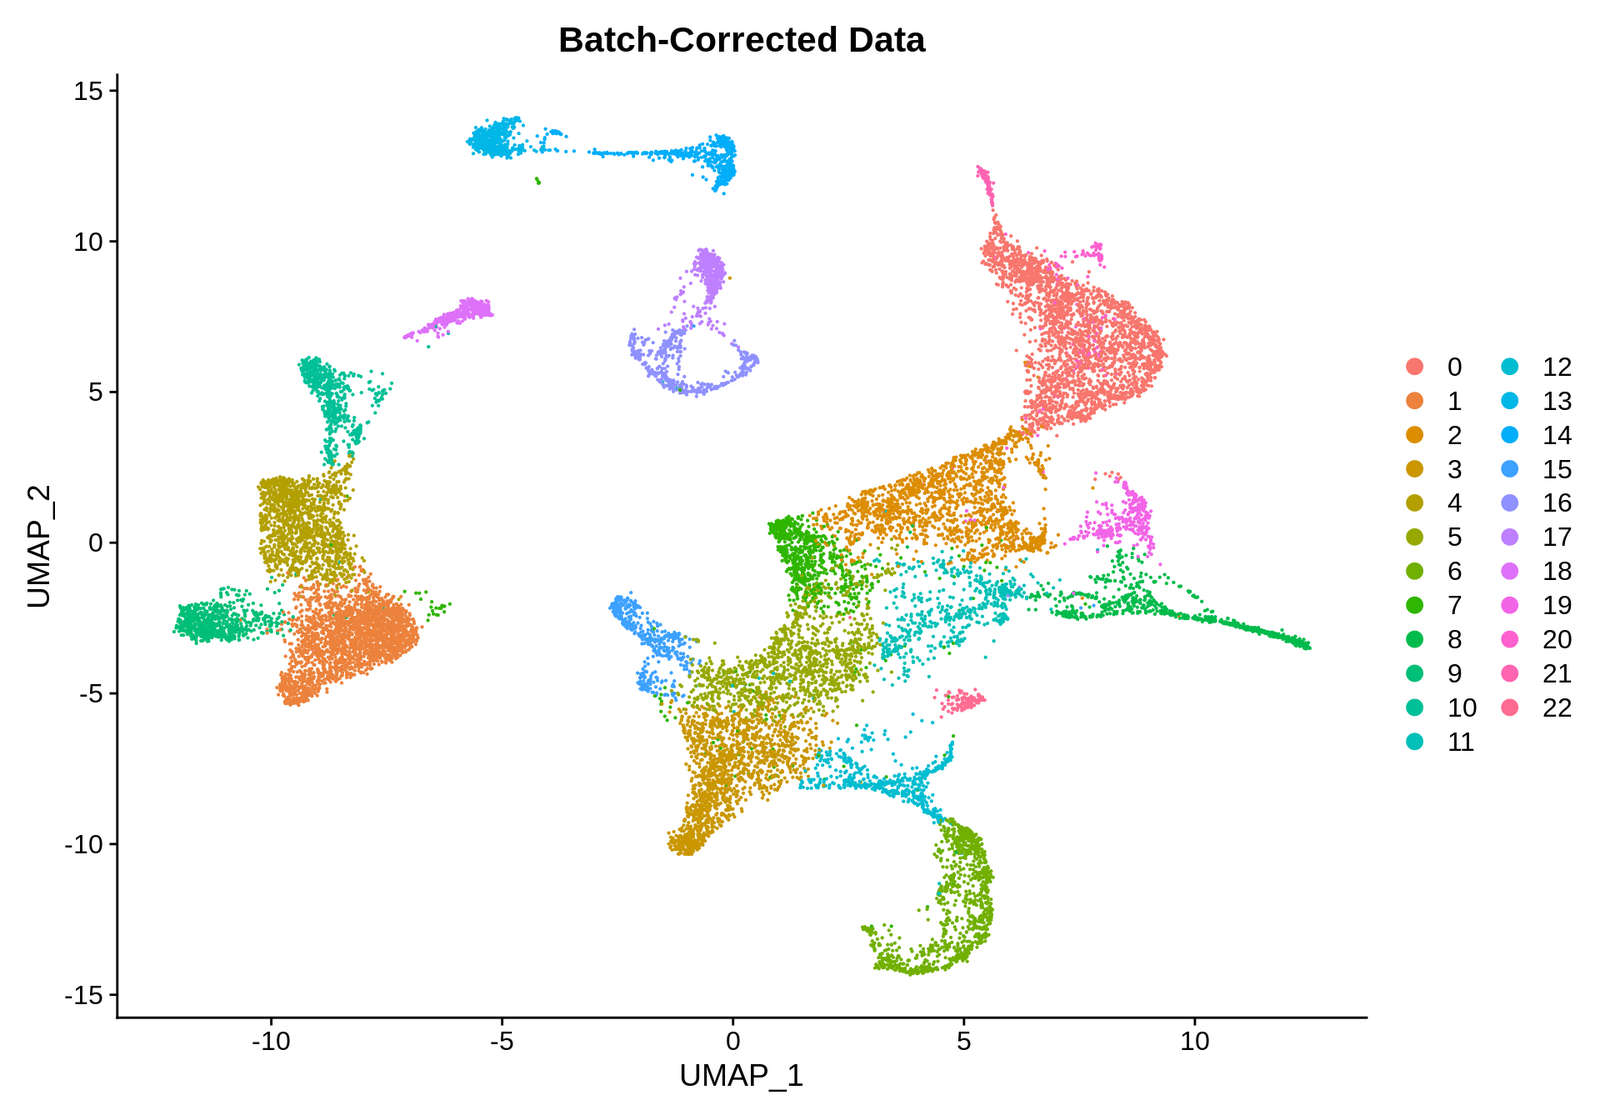 UMAP of all four samples after Seurat's anchor-based integration, colored by unsupervised cluster (23 clusters at this resolution, later collapsed to 16 cell types).
|
**Cell-type annotation**
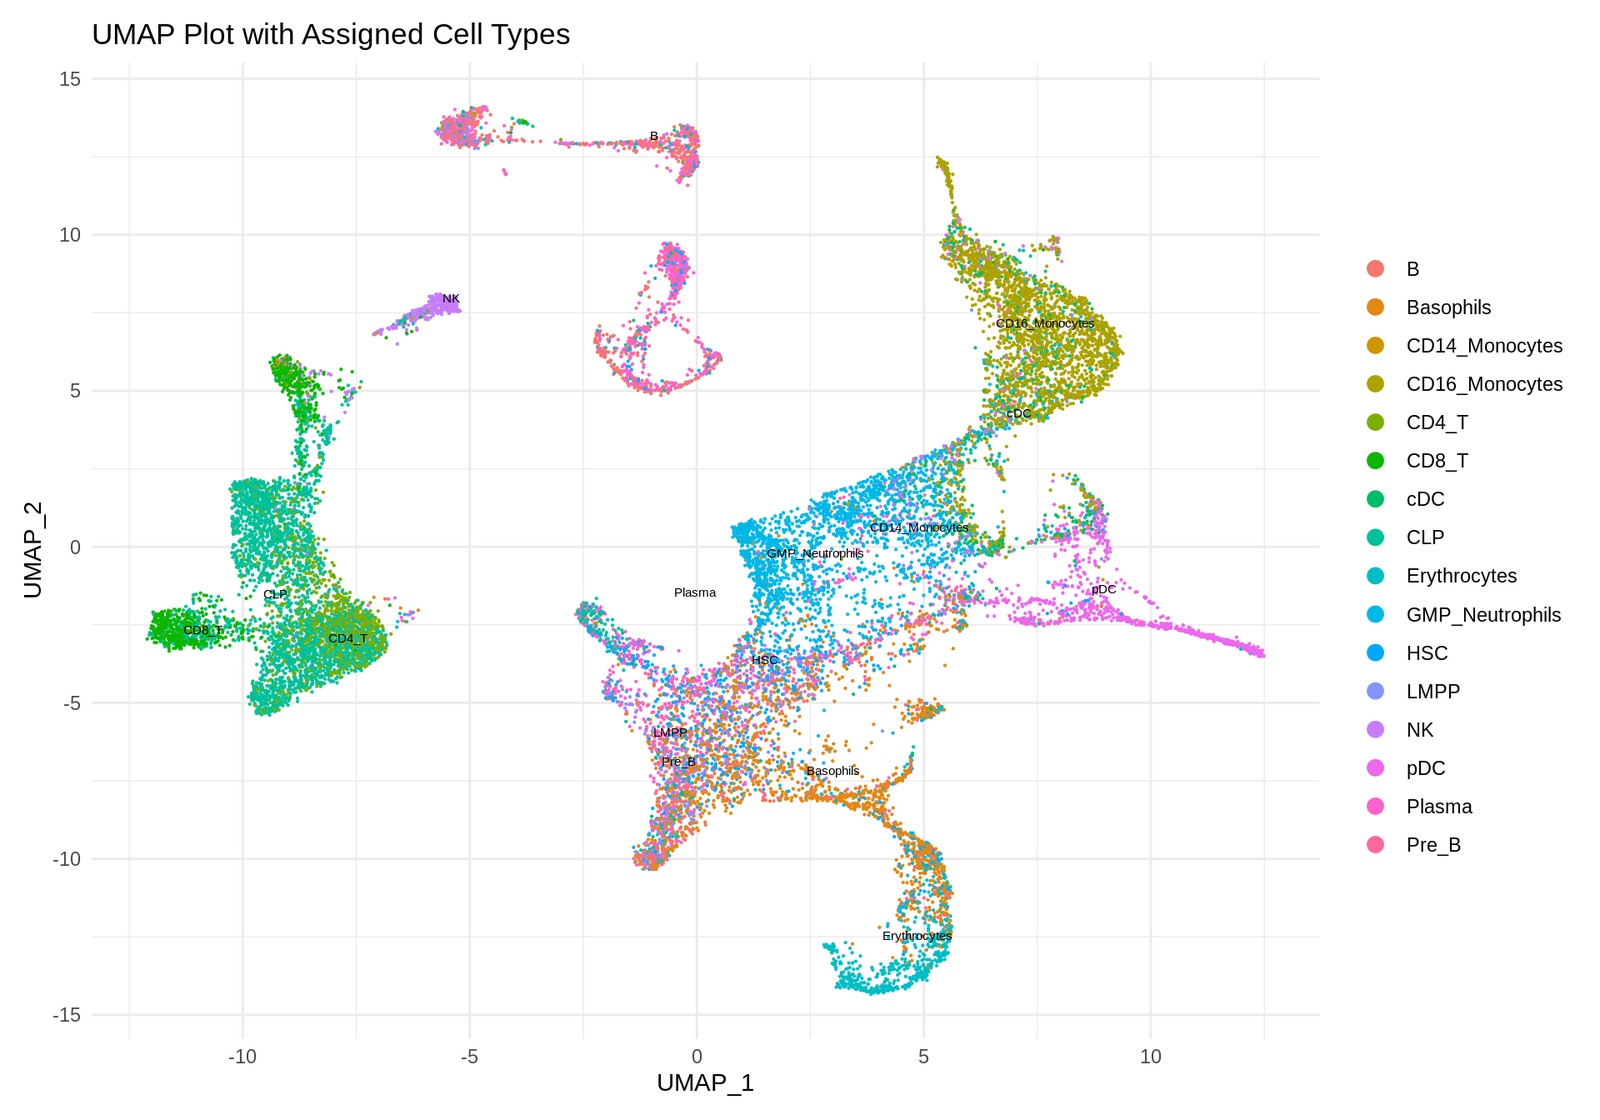 Final manual cell-type annotation, based on differential expression plus a panel of canonical lineage marker genes.
|
**Annotation agreement**
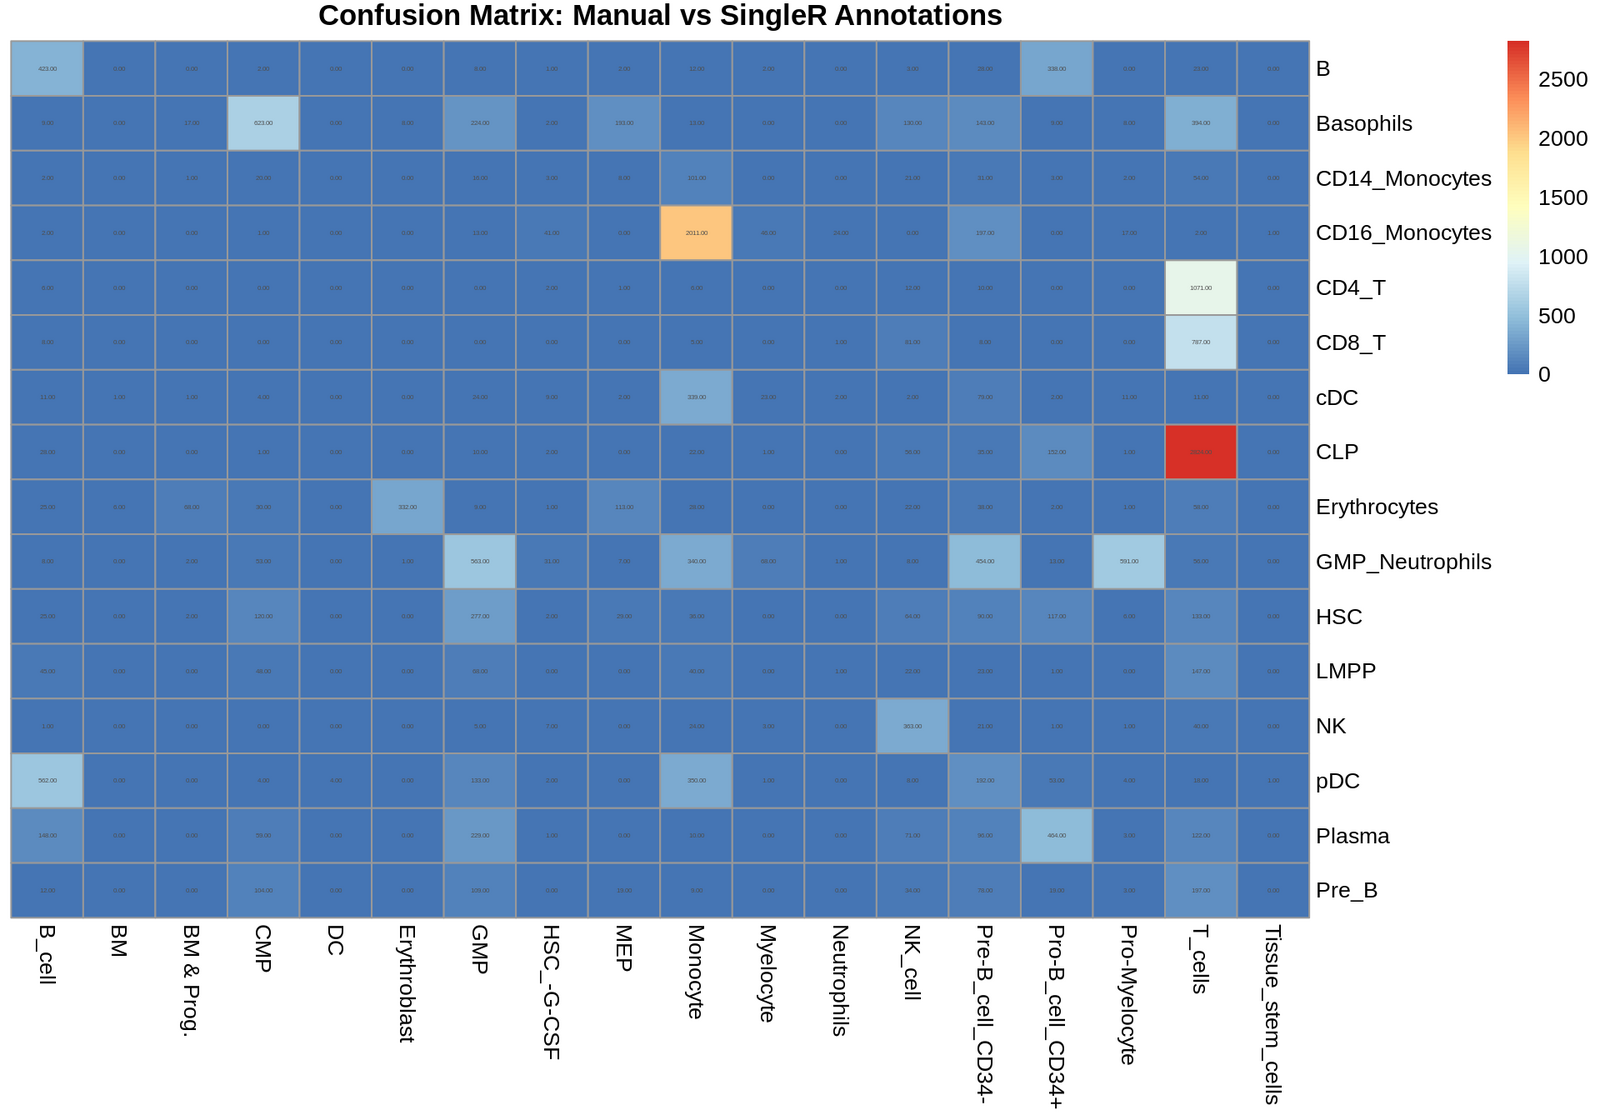 Confusion matrix comparing the manual, marker-based annotation against `SingleR`'s automatic labels — strong agreement on well-separated types (T cells, CLP, CD16+ Monocytes), more disagreement in the progenitor compartment where marker signal is weaker.
|
**Sample composition**
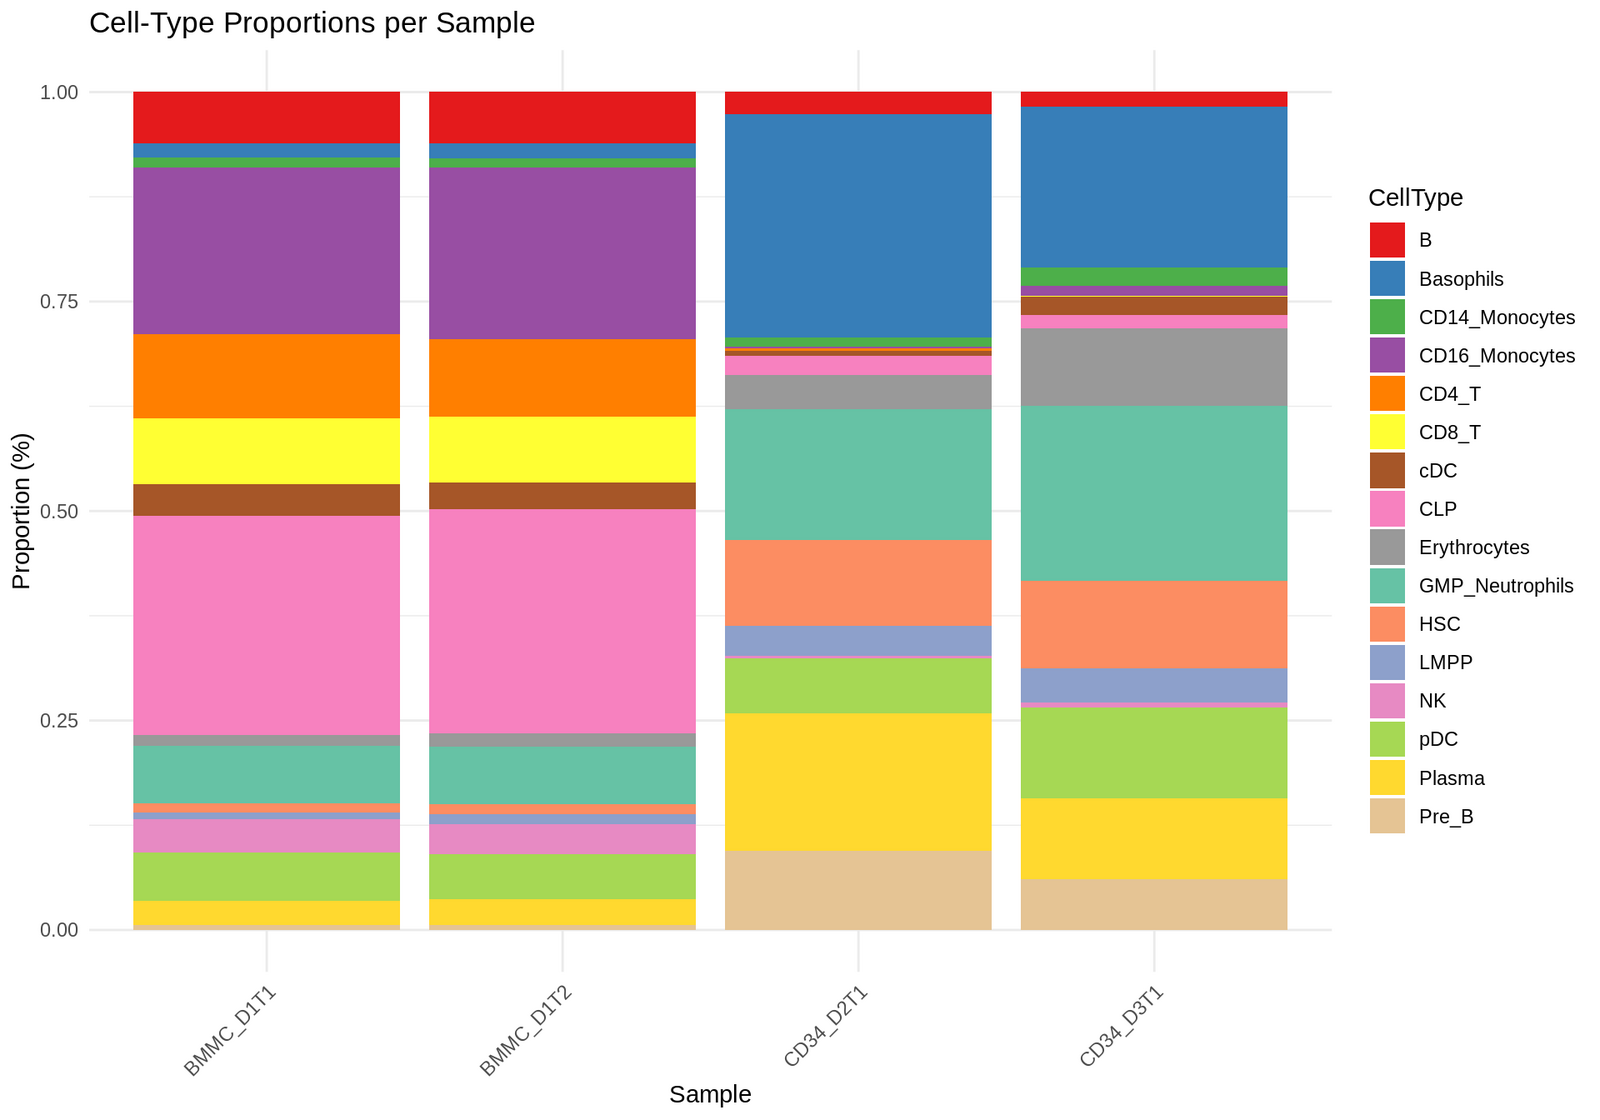 Cell-type proportions per sample — BMMC samples are dominated by mature lymphoid/myeloid cells (T, B, CLP, Monocytes), while CD34+ samples are enriched for stem/progenitor populations (HSC, GMP/Neutrophils, LMPP), consistent with CD34+ selection.
|
**Differential expression**
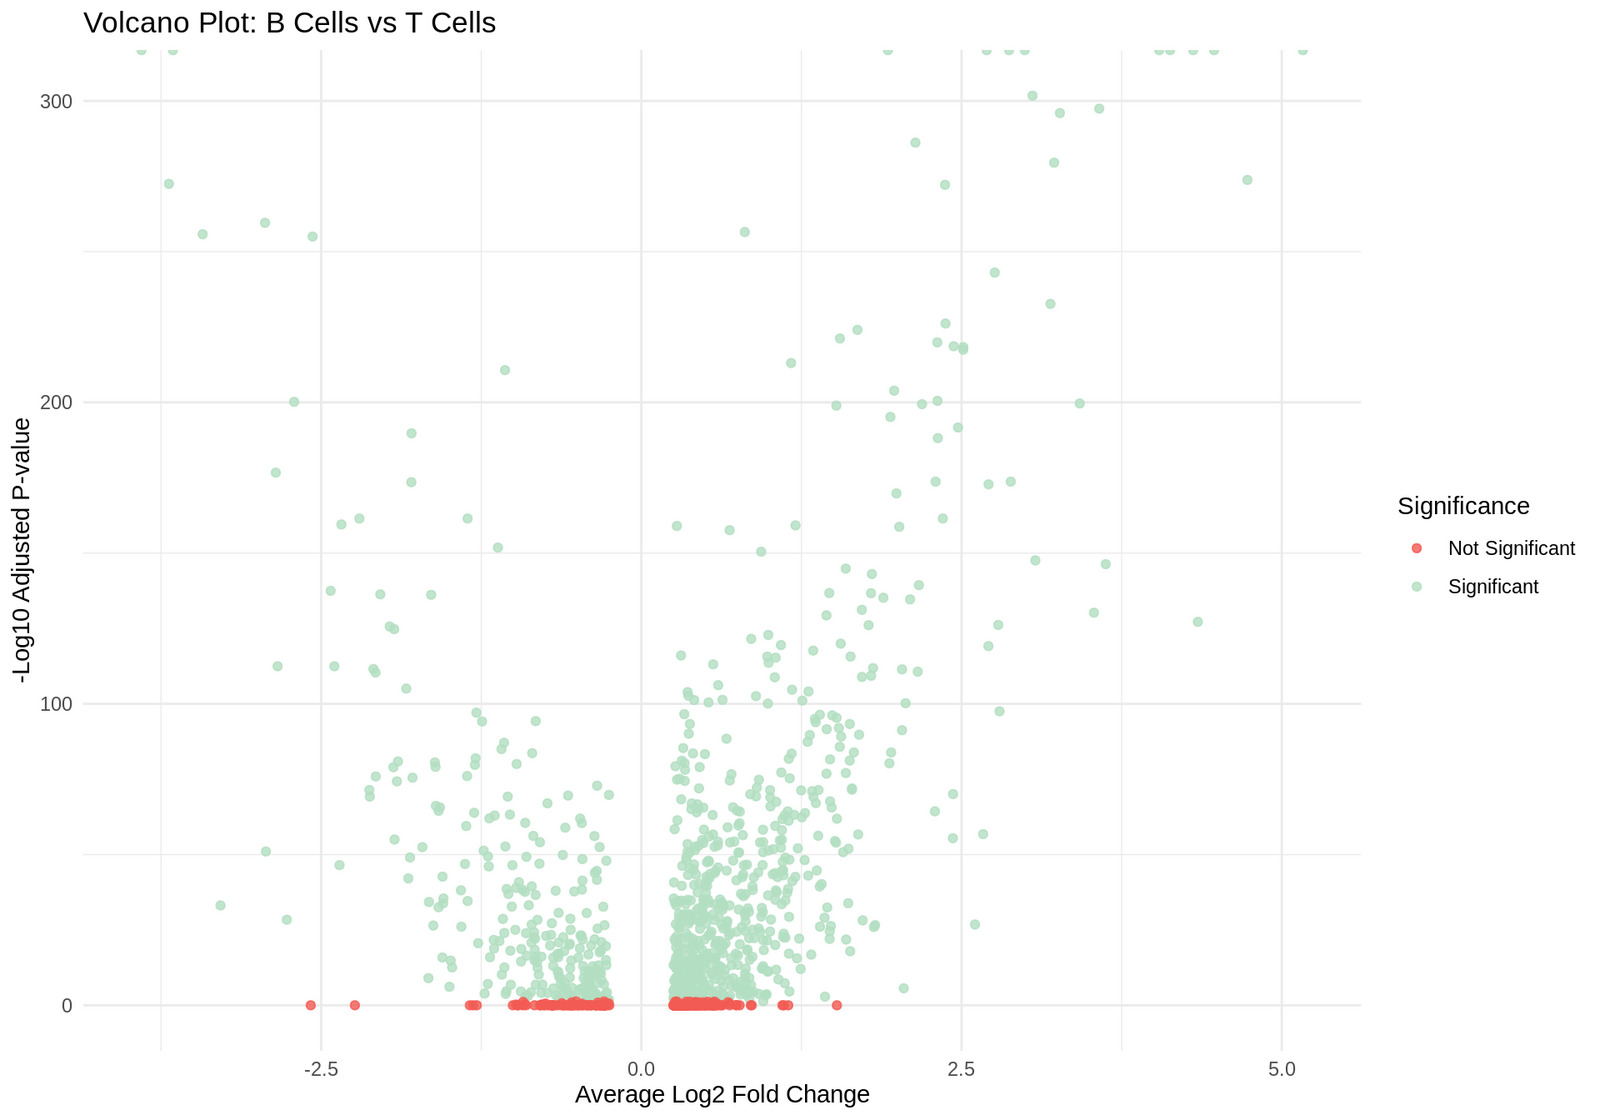 Volcano plot for B cells vs. T cells — thousands of genes pass the significance threshold given the strong transcriptional separation between lymphoid lineages.
|
**Trajectory analysis**
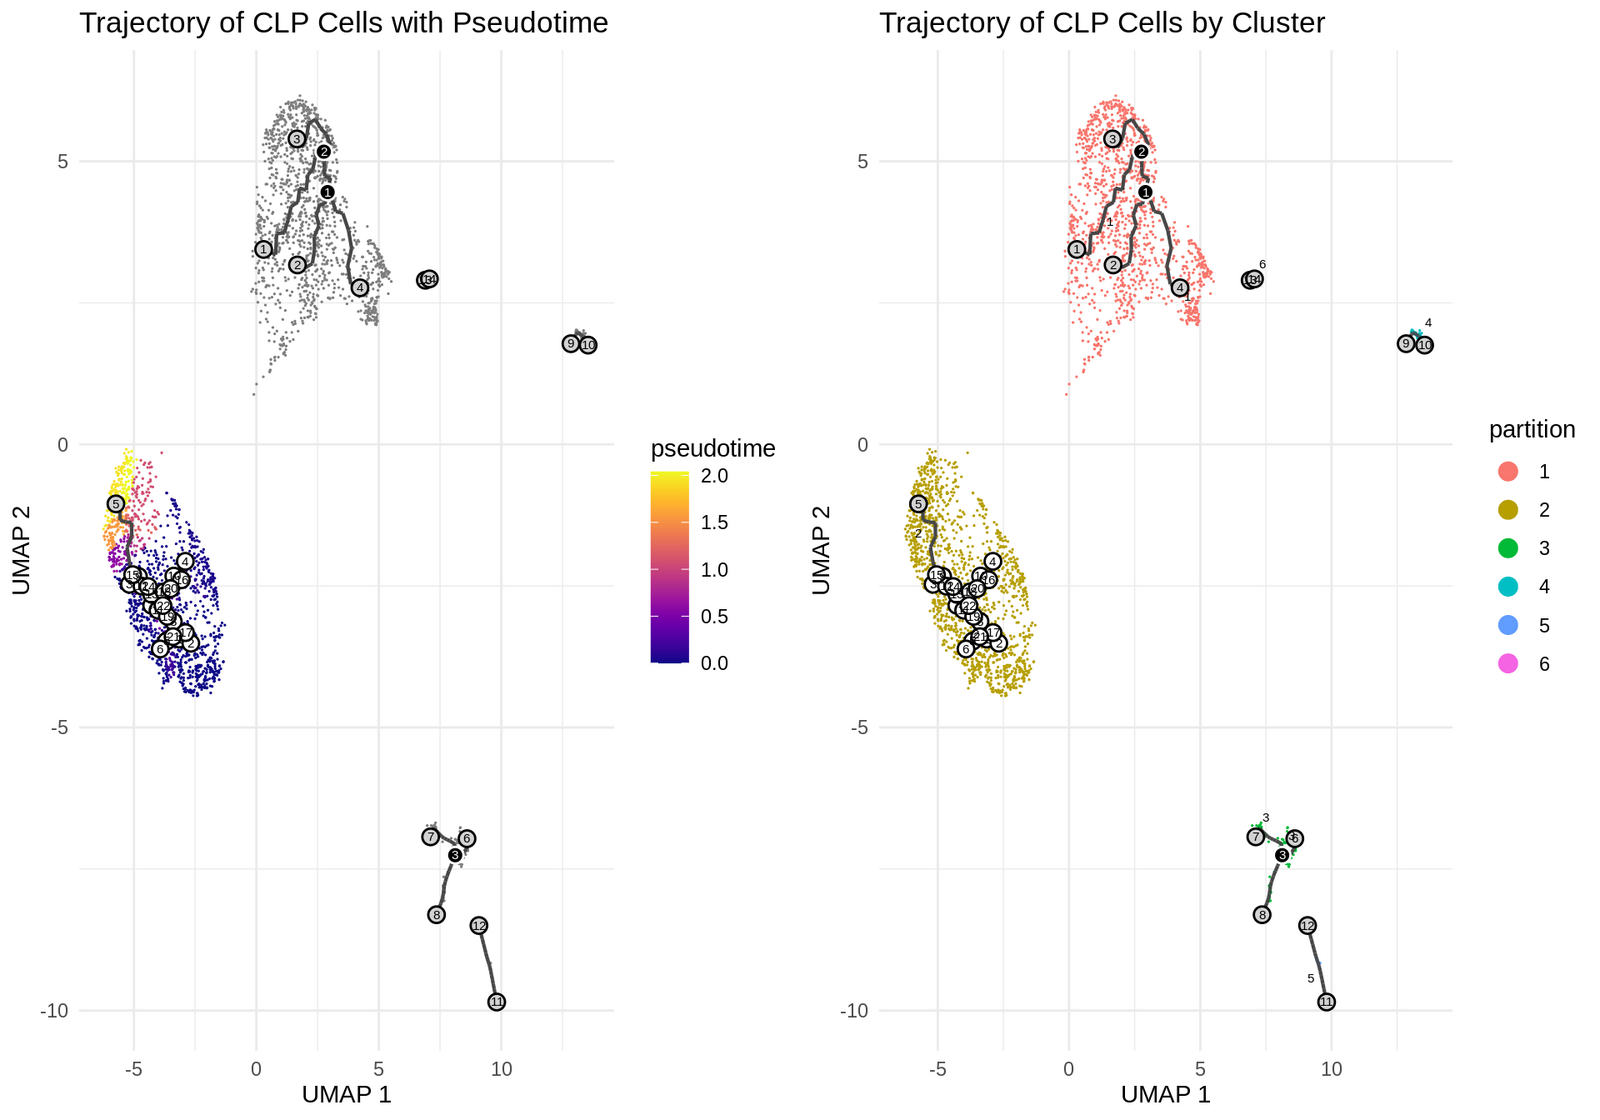 `Monocle3` pseudotime trajectory restricted to Common Lymphoid Progenitors, rooted at the least-differentiated end of the population.
|
**Cell-cell communication**
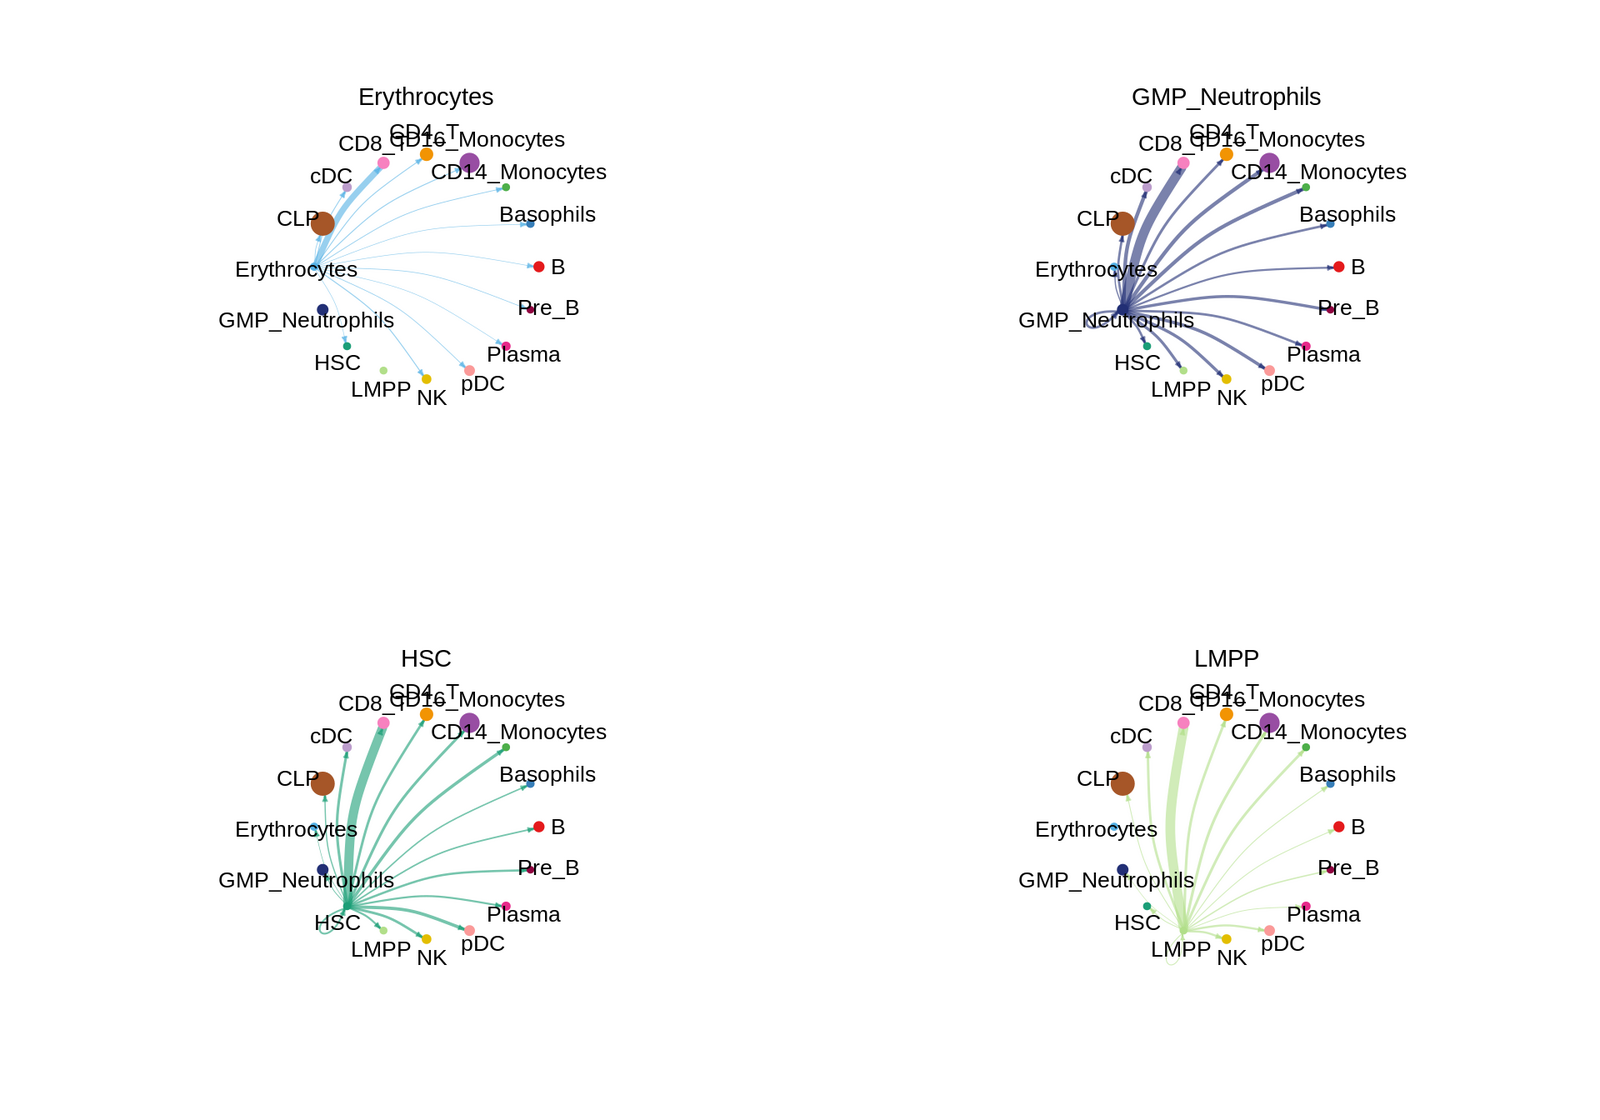 `CellChat` circle plots showing inferred outgoing signaling strength from selected progenitor and myeloid cell types toward the rest of the cell-type repertoire.
|
## What the data shows
**The annotated populations are consistent with active hematopoiesis.** Common Lymphoid
Progenitors are the single largest population (17.4%, 3,249 cells), followed by
Granulocyte-Monocyte Progenitors (12.9%, 2,419 cells). The progenitor compartment
(CLP, GMP, HSC, LMPP) together with a full complement of mature lymphoid and myeloid
cells is what one expects from bone marrow rather than peripheral blood.
**Transcriptional output tracks cell function.** Erythrocytes carry the highest median
UMI count (4,358) and the most genes detected per cell (1,905), consistent with the
heavy globin transcription of erythropoiesis. CLP cells distribute across 19 separate
clusters — more than any other type — indicating substantial heterogeneity in
maturation state, whereas CD16+ Monocytes occupy only 9, a comparatively homogeneous
population.
**CD34+ selection is visible throughout.** BMMC samples are dominated by mature
lymphoid and myeloid cells, while CD34+ samples are enriched for HSC, GMP/Neutrophil
and LMPP progenitors (see the proportions plot above). The same signal appears in the
enrichment analysis: the top GO Biological Process term separating the two groups is
**neutrophil degranulation** (GO:0043312) — a mature granulocyte effector program that
CD34+-enriched samples largely lack.
**Pseudotime recovers B-lymphopoiesis.** Rooting the CLP trajectory on an IL7R-high
cluster produces an ordering along which CD19 and MS4A1 rise together, from
marker-negative progenitors through intermediate states to mature B cells. Because
those two markers were not used to build the trajectory, their monotonic increase
along pseudotime is independent support that the ordering reflects real
differentiation rather than an artifact of the embedding.
**Cell-cell signalling separates the two compartments sharply.** Restricting to the
16 cell types present in both groups, BMMC supports roughly three times the inferred
interactions of CD34+ and four times the total interaction strength:
| | BMMC | CD34+ |
|---|---:|---:|
| Cells | 11,343 | 7,350 |
| Significant pathways | 23 | 12 |
| Inferred interactions | 2,061 | 622 |
| Total interaction strength | 111.7 | 28.5 |
Ten pathways are shared. Thirteen are BMMC-specific — including **MHC-I**, **CD45**,
**LCK**, **CD22**, **CD23** and **ICAM**, essentially the lymphocyte antigen-receptor
and adhesion machinery of a mature immune compartment. Only two are CD34+-specific,
**NEGR** and **CDH**, both adhesion families, consistent with progenitors engaging a
stromal niche rather than each other.
MIF is also the pathway visualised in detail in the notebook, chosen precisely because
it is significant in *both* groups — a comparison the analysis could not make while it was
plotting WNT, which appears prominently in the CellChat reference database but is not
inferred as significant in either group here.
The per-pathway strengths sharpen the contrast. **MHC-II** signalling is roughly
nine-fold stronger in BMMC (13.1 vs 1.5), as expected when professional
antigen-presenting cells are depleted by CD34+ selection. The one pathway that runs
*against* the trend is **midkine (MK)**, which is stronger in CD34+ than in BMMC
(5.2 vs 2.3) — notable because midkine is a growth factor associated with progenitor
proliferation, so its relative prominence in the progenitor-enriched samples is
biologically coherent rather than incidental.
## Repository structure
```
├── analysis/
│ ├── scrna_seq_analysis.Rmd # full annotated analysis source
│ ├── report.html # rendered notebook — start here
│ └── sessionInfo.txt # exact R + package versions used
├── data/ # input Seurat objects + celldex reference (Git LFS)
├── envs/
│ ├── environment.yml # loose conda spec
│ ├── environment.lock.yaml # pinned conda packages (linux-64)
│ └── r-packages-verified.csv # manifest of a known-working environment
└── figures/ # figures used in this README
```
## Reproducing
```bash
git clone